Sweeping soot out of the atmosphere
Originally posted on the EGU Blog Network here.
—————————————————————————————————————————————————————————————————————————————————————————–
Efforts to slow the rate of global temperature rise in the 21st Century have for some time focussed on non-CO2 species or so-called ‘short-lived forcers’. As far as aerosols are concerned, black carbon (often referred to as soot) has been the main avenue to explore due to its capacity to warm the atmosphere by absorbing sunlight. Black carbon contrasts with most other aerosol species which tend to cool the Earth, so reducing emissions of black carbon is attractive as it has the twin benefits of reducing future global temperatures and improving air quality. The hard part is that black carbon tends to get mixed up with other members of the atmospheric aerosol gang, with the outcome being highly uncertain. A recent review concluded that the overall impact of black carbon combined with its co-emitted partners was slightly negative but with huge uncertainties; the estimates ranged from cooling or warming that was comparable to the impact by carbon dioxide! Black carbon and its accomplices could either be offsetting the historical impact of carbon dioxide or adding extra warming on top.
Bearing the above in mind, the idea to slow global warming by reducing black carbon emissions has been around for more than a decade. Thirteen years ago, James Hansen and colleagues proposed reducing emissions of black carbon and non-CO2 greenhouse gases in order to slow the rate of global temperature change due to increasing concentrations of CO2 by 2050. This was soon followed by a somewhat sceptical perspective in Science by Smith et al. that pointed out the difficulties in targeting individual pollutants with emission controls and the large uncertainties associated with aerosols. Mark Jacobson illustrated with a global aerosol simulation that eliminating black carbon and the associated organic aerosol from fossil fuel burning would reduce net warming by 20-45% within a 3-5 year period. For CO2 emissions to have the same effect, they would need to be reduced by a third but the reduction in net warming would take 50-200 years. Tami Bond has contributed some typically thoughtful and thorough articles to the discussion, concluding that despite the large uncertainties, reducing all aerosol emissions from major sources of black carbon will reduce direct climate warming. Furthermore, she showed that the largest benefits can be gained by reducing emissions in developing countries, where a large proportion of the black carbon source occurs.

Transmission electron microscopy (TEM) images of aerosol particles, including black carbon from Posfai et al. (1999). In panel A, the black carbon particles (denoted by the small arrows) are mixed with inorganic ammonium sulphate particles. In panel B, a typical chain-like black carbon aggregate is shown with the arrows pointing to a film of carbon that connects the individual spherules within the aggregate. In panel C, fly-ash spheres are shown, which are particles that are often associated with black carbon particles. The scales give an idea of the size of these particles – a human hair is around 100µm or 100,000nm.
Recently, reducing black carbon emissions has been highlighted by a UNEP report and an associated article in Science, which showed that targeting methane and black carbon emissions could knock off around 0.5°C (with a range of 0.2-0.7°C) by 2050 compared to the current projected temperature rise. This weeks’ Smith et al. paper in PNAS suggested a lower central result of 0.16°C (with a range of 0.04-0.35°C). The large ranges in temperature reduction in both studies were mainly due to the uncertainty in aerosol effects. Coverage of the most recent paper has focussed on the idea that such emission reductions will not “save us from climate change” (e.g. here, here, here and here). While this is very likely true, having read the work in this area, nobody has been suggesting this anyway! For example, Hansen et al. stated:
This interpretation does not alter the desirability of limiting CO2 emissions, because the future balance of forcings is likely to shift toward dominance of CO2 over aerosols.
While Shindell et al. stated:
…eventual peak warming depends primarily on CO2 emissions, assuming air quality–related pollutants are removed at some point before peak warming.
The argument for reducing short-term forcing species has been predicated on slowing global temperature rise over the first half of the 21st Century, not halting it. The potential benefits of this include more time to develop CO2 reducing policies/technologies, slower sea-level rise and reduced warming in susceptible environments, such as the Arctic. These are just some of the climate benefits, with advantages for human health and ecosystems also being highlighted.
The short atmospheric lifetime of black carbon also raises a question mark over whether a global temperature perspective is the most appropriate measure. Unlike the longer-lived greenhouse gases, the climate warming from black carbon is much more regional in nature and it is on these scales that the impacts are most keenly felt. For example, black carbon emissions for energy generation are concentrated in North America, Europe and Asia, so their impact is stronger in the Northern Hemisphere. Emissions from cooking stoves are more prevalent in developing countries in the tropics, while deforestation, which accounts for around a third of black carbon emissions, is also focussed in tropical areas. Consequently, any future policies or technological developments will need to take these into account if a reduction of black carbon emissions is to slow future temperature rises and the potential consequences of this. Whether the science is suitably mature to inform climate policy decisions in this area though remains to be seen; the studies highlighted all point to black carbon exerting a net warming up to 2050 but the magnitude of its effect and the feasibility of reducing emissions is highly uncertain.

Unfortunately, Sweep’s magic wand wasn’t enough to reduce Sooty’s contribution to climate change. Image from here.
If it wasn’t for those pesky aerosols…
Originally posted on the EGU Blog Network here.
——————————————————————————————————————————————————————————————————————————————————————————————–
Climate change is a subject that science knows a lot about; broadly, we can demonstrate that greenhouse gases have accumulated in the atmosphere over the past 200 years or so due to our burning of fossil fuels and that this has led to a rise in temperatures across the globe. However, our atmosphere is a complex beast and we have proven particularly adept at altering it. It turns out that as well as adding greenhouse gases to our atmosphere, we have also been adding a bunch of tiny particles into the mix. These particles are known as aerosols and they only stick around for short periods in the atmosphere, with a month-old aerosol particle being considered elderly. Many only last a few hours as they either crash into the ground or get washed away by rainfall. This contrasts with greenhouse gases, many of which stay around for decades to centuries.
While greenhouse gases have warmed our planet, aerosols act as a counter-balance to this warming – they cool the planet via a number of processes that reduce the amount of sunshine reaching the Earth’s surface. To complicate matters a little further, some of them, such as black carbon, warm the planet. Overall though, our best estimates of the impact of aerosols on our climate suggest that they have taken the edge off the warming expected from greenhouse gases. However, the major caveat here is that the level of cooling from aerosols is highly uncertain, both for the last 200 years and for the next century. This presents a problem for our ability to test our understanding of the climate system and project how it will change in the future.

Image of the global aerosol distribution produced by NASA. The image was produced using high-resolution modelling by William Putman from NASA/Goddard. The colours show the swirls of aerosol particles formed from the numerous sources across the globe. The colours show aerosol particles as dust (gold/brown), sea-spray (blue), biomass burning/wildfires (green) and industrial/urban (white).
Aerosols have saved us from global warming then? Not really – aerosols are harmful to our health, specifically contributing to respiratory and heart disease when we breathe them in. We also expect the amount of aerosol in the atmosphere to decline in the future so they won’t provide as strong a cooling effect in the long term.
Embracing uncertainty
So, why are we so uncertain about aerosols? Here are a few of the issues.
1. They are hard to measure.
The first port of call when we try to understand aerosols is actually observing them in either the laboratory or in their natural habitat in the atmosphere. In an ideal world, we want to know the size, shape and chemical makeup of each particle while also understanding how it interacts with both light and water in the atmosphere. Now, consider that these particles range from approximately 10-100,000 times smaller than a human hair and that the number of particles in a piece of air around the size of a sugar cube can range from a few to hundreds of thousands. We want to know how they change over the course of a few minutes, a day and seasonally, as well as having an idea of their historical evolution. We also want to know how they vary across the globe in different environments and how their properties change in different vertical slices of the atmosphere. The really tough part is that because of their short lifetime, they don’t get mixed evenly throughout the atmosphere so there are large regional and vertical gradients in their properties. Keeping an eye on all of that is difficult!
2. We’re not sure where they come from.
On the face of it, the answer is quite simple; we know that aerosols come from both natural and man-made sources. However, we don’t know what proportion is from each of these sources. There is the added complexity of them interacting with each other to form new aerosols. For instance, naturally emitted compounds from trees can interact with emissions from car exhausts to form aerosol particles; is that natural or man-made? If we want to control them in order to alleviate their harmful impacts, we need to know what to control. Our knowledge of aerosol history is patchy, so even if we knew everything about present-day aerosols (which we certainly don’t) we would still struggle to work out the impact of them today compared to the past.
3. Modelling aerosol is hard.
There are a vast array of existing aerosol models which aim to aid our understanding of their properties and impacts. A recent comparison between 10 current climate models that include aerosols found that they are similar in terms of the global amount of aerosol and that they compare reasonably well with satellite observations. The trouble is they don’t always paint a consistent picture in terms of which aerosol components drive this. Some models say dust is the most important species, others say sea-salt, while others say sulphate. This seems like a classic case of being right for the wrong reasons. Furthermore, the models strongly underestimate the absorption of sunlight by aerosols (which can lead to heating rather than cooling) in many regions, which suggests that we don’t yet really understand this important aspect. These are just a couple of examples of current issues with modelling aerosols.
4. We don’t have a crystal ball.
Bearing all of the above in mind, if we are to make projections of future climate impacts due to human activities we need to know how aerosols will change over the coming decades. Historically, changes in man-made aerosol emissions and their properties have been driven by concerns surrounding their impacts on our health and environmental effects, such as acid rain. This has led to large reductions in chemical species such as sulphate and black carbon in North America and Europe, where Clean Air Acts were introduced decades ago. The aerosol landscape in rapidly developing countries in Asia, South America and Africa is difficult to predict. Overall, we expect aerosol amounts to decrease in the future but we might see other chemical species playing a more dominant role. For instance, as the importance of sulphate aerosol decreases, we might see our attention turning towards nitrate aerosol. How aerosol properties evolve in the future is highly uncertain, which presents a challenge when we try to project how the climate will change during the 21st century.
So there we have it, just a few of the reasons why aerosols are tricky to understand in terms of climate change. This is without considering how they impact our health or their effect on ecosystems. My aim with this blog is to explore this vast area of research that I unwittingly stumbled into around eight years ago.
Announcement: joining the EGU blog network
The title explains the purpose of this post really; I’ve joined the EGU blog network. The network is expanding to supplement the already existing (and excellent) blogs that are housed there. It is a great honour and privilege to join the network and I’m looking forward to communicating the world of air pollution and atmospheric science research to a wider audience. I will still post copies of my posts here so it doesn’t impact existing subscribers but new posts will be posted on the EGU hosted site first. The website and first post are here. There is also a Twitter list of all of the contributors available here.
Hope you enjoy the new site!

Banner for new site. For credits, see sidebar or here.
The most annoying aerosol in the land
Sunshine and hot temperatures are warmly embraced when they visit the UK with the population routinely confused by a strange glowing object in the sky. Unfortunately, such weather is often accompanied by the release of large amounts of pollen, causing allergic reactions for one-in-five people. This green and pleasant land is a wonderful place in the summer sun but it comes with a sting in the tail.
Pollen in the atmosphere is actually an aerosol particle as the grain is suspended in air. If we were to group aerosols in terms of their size, pollen would be classed as extra-large. They are small enough to be relatively easily carried by the wind but large enough that they don’t get carried a particularly long distance.

Pollen from a variety of common plants. The image is magnified by a factor of 500, so the bean shaped grain in the bottom left corner is about 50 μm long. Image courtesy of Wikipedia.
The video below shows the release of a particular type of pollen from a white mulberry tree, Morus alba L. Details of the study from which the video was obtained are here. The abstract describes the pollen as being “catapulted explosively”, which is a wonderful phrase and vividly describes the release of the aerosol. The abstract goes on to describe the stunning release of the pollen in further detail:
The sudden release of stored elastic energy in the spring-like filament drove the stamen to straighten in less than 25 μs, and reflex the petals to velocities in excess of half the speed of sound. This is the fastest motion yet observed in biology, and approaches the theoretical physical limits for movements in plants.
As well as hay-fever, grass pollen has been linked to asthma via a complex process where plants undergo a cycle of wetting and drying. Pollen had long been associated with asthma (particularly after thunderstorms) but the process wasn’t clear as pollen grains are typically too large to reach the airways where asthmatic reactions originate. However, this wetting-drying cycle leads to the release of much smaller fragmented pollen aerosol particles that are small enough to penetrate further into our airway and contained allergic material.
As a hay-fever sufferer, I would definitely class pollen as the most annoying aerosol in the land. At best, it presents discomfort for hay-fever sufferers when they want to enjoy warm weather and at worst, it can have major implications for asthmatics.
————————————————————————————–
The Met Office provide forecasts and further information for pollen here.
ICNAA 2013 part two: stressing the environment
I spent last week at the International Conference on Nucleation and Atmospheric Aerosols (ICNAA) in Fort Collins, Colorado. This is the second of a two-part series of posts reflecting on the conference. The first part is here.
Fire in the wild
Given that ICNAA was held in Colorado, the constant backdrop to the conference was the series of wild fires that have been burning both within the state and further afield. Local news reports was dominated by reports of both new fires and efforts to control existing ones. Several of the conference participants are studying how the smoke from such fires evolves in the atmosphere and what impact it has, so there was a lot of professional interest in the fires also. My own talk at the conference was on fires in Brazil as part of the SAMBBA project that I was a part of last year.

Satellite image of the West Fork complex fires in Colorado from the Moderate Resolution Imaging Spectroradiometer (MODIS). Image courtesy of NASA. Some more incredible images of the fire are available here and here.
I was lucky enough to visit Rocky Mountain National Park during my visit and this included a fascinating presentation by a park ranger about some of the strains on the flora and fauna in the park. Wild fires were an obvious focus, especially with the Big Meadow fire still burning within the park. Signs around the park reminded visitors that the fire risk was “very high”. The danger presented by fires in the national park is huge and the ranger referred to the Fern Lake fire last year, which spread 3 miles in just 36 minutes.
One of the most striking things when travelling through the park was the number of dead/dying trees. The major culprit here is an epidemic of bark beetles that have been killing the trees within the region. Around 90% of the trees within the national park itself have been affected by the bark beetles. While bark beetles are a natural part of the local ecosystem, their numbers have increased in recent years as more and more have survived the winter. Usually the heavy snowfall and cold temperatures in the winter would significantly reduce their numbers but a run of shorter and warmer winters has seen their numbers grow. Potentially this can increase the risk of fires occurring and/or make them more intense, although the major protagonist for the increasing number of fires is the sustained warm weather in the region

Picture I took of some burnt out and fallen trees on a walk through the National Park.
The ranger was very quick to point out the role of climate change influencing the national park. The park has got progressively warmer over the past 30 years, with vegetation spreading further up the mountain slopes and various invasive species thriving in the warmer temperatures. One such invasive species, cheatgrass, has been implicated in making fires worse and more frequent. Adaptation to climate change was a clear concern with programmes under-way to combat the spread of the invasive plant species and the obvious threat from wild fires. Some of the impacts of climate change on the park are detailed in this report (pdf). The approach is informed by this foreword from the report:
The knowledge necessary to make a perfect analysis of the impacts of potential courses of … management action … does not exist. It probably never will. But more knowledge is available than has yet been brought to bear on this problem. To be useful, that knowledge must be organized so it makes sense…. To say we don’t know enough is to take refuge behind a half-truth and ignore the fact that decisions will be made regardless of the amount of information available*
Another human influence in the park is the accumulation of nitrogen within the confines of the park from agricultural and fossil-fuel burning activities that are transported from areas outside of the park. Nitrogen serves as a nutrient to plant species but the natural vegetation in the park is used to low nitrogen conditions; the current level of nitrogen deposition is 15 times larger than the natural limit expected within the park. This can lead to further inroads from invasive species at the expense of the historical vegetation that the park aims to protect. Nitrogen deposition has declined over the past couple of decades, with a levelling off in recent years. The park has ambitions plans to reduce levels further to ‘tolerable’ rates by 2032, although much of this relies on efforts outside of the jurisdiction of the park. The Nature & Science page on their website includes this neat summary:
If the current amount of total nitrogen deposition measured at the high-elevation monitoring site in Rocky Mountain National Park (3 kg/ha/yr) was the same throughout the park, the amount of airborne nitrogen entering the park would be equivalent to 35,500 twenty-pound bags of fertilizer.
Clearly the park is a susceptible environment to human pressures from both climate change and air pollution but it was striking (and heartening) how proactive they were in attempting to mitigate and adapt to these pressures.

While this post has been about the scientific curiosities within the park, it is worth highlighting just how breath-taking (almost literally – 10,000 ft is high!) the park actually is.
Wrap up
Hopefully these recent couple of posts have brought together some interesting highlights of what was an excellent conference. As ever, it was great to see old friends and meet new people. Finally, if you are ever in Colorado, Fort Collins is well worth a visit with the beautiful and original ‘Old Town’ central district being the main attraction. Furthermore, I can personally vouch for several of the breweries and their beer…
———————————————————————————————————————————————————————————————————————————-
* J.W. Thomas. 1979. Preface, p. 6-7. In: J.W. Thomas (ed.) Wildlife Habitats in Managed Forests – the Blue Mountains of Oregon. U.S. Department of Agriculture Handbook No. 553. U.S. Government Printing Office, Washington, D.C. Serves as the foreword to the park’s report (pdf) ‘Climate Change in Rocky Mountain National Park: Preservation in the Face of Uncertainty’.
ICNAA 2013 part one: building blocks
I spent last week at the International Conference on Nucleation and Atmospheric Aerosols (ICNAA) in Fort Collins, Colorado. Compared to most conferences in my field, ICNAA is quite small with just over 200 delegates attending a choice of two parallel sessions. Compared to the AGU or EGU general assemblies, which have over 20,000 and 10,000 participants respectively, ICNAA is very small and has a much narrower focus than other conferences. ICNAA is also slightly different in that there is a three-to-four year gap between each conference, rather than the more standard annual cycle. I attended the last ICNAA in 2009 that was held in Prague (hard life this science lark) and the four year gap between conferences gives a different perspective on how the science has evolved over recent years.
Below is the first of a two-part series of posts reflecting on the conference.
Aerosol building blocks
Probably the major focus of the conference is a process known as ‘nucleation’, specifically of aerosol particles. This is where gaseous molecules cluster together and decide that they’ve had enough of the gas-phase and would prefer to be tiny aerosol particles instead. When I say tiny here, I really mean tiny; the initial particles are around 100,000 times smaller than the width of a human hair!
Since the previous ICNAA in 2009, there has been huge progress in the science surrounding this area. Much of this has been a result of new instrumentation that can observe both the molecular clusters and the very first aerosol particles that are formed. Previously, we were only able to observe the aerosol particles after they had grown a little larger.

View inside the CLOUD chamber. Image courtesy of CERN.
The other major driver has been a series of experiments at CERN using the ‘cleanest box in the world‘. The project is known as CLOUD and it aims to study the different potential building blocks for these aerosol particles. For many years, it was known that the nucleation cocktail required the presence of sulphuric acid in order to occur but CLOUD has been able to show how important other molecules are. The first major result from the project was published in Nature in 2011 and demonstrated that ammonia was a crucial ingredient for nucleation. The obsessive cleanliness of the laboratory turned out to be crucial here as minuscule amounts of this material are required for nucleation; ammonia is very ‘sticky’ so the potential for contamination is very high. In fact, the results from CLOUD suggest that many similar experiments in the past suffered from contamination, which would have led to scientists thinking that only sulphuric acid was required for nucleation when really there were tiny amounts of ammonia messing up their experiments.
The early results also demonstrated that ions from cosmic rays could be important for nucleation in the mid-troposphere but not closer to the ground (known as the atmospheric boundary layer) where nucleation is most often observed. The overall conclusion of the early results was:
…even with the large enhancements in rate due to ammonia and ions, atmospheric concentrations of ammonia and sulphuric acid are insufficient to account for observed boundary-layer nucleation
Something else is involved in nucleation, with the primary suspect being organic compounds. Much of the work at CLOUD since then has studied different organic compounds and has found that they contribute to both the initial nucleation of the particles and crucially, their growth. If they didn’t grow then they would quickly be lost from the atmosphere and their impact would be minimal.
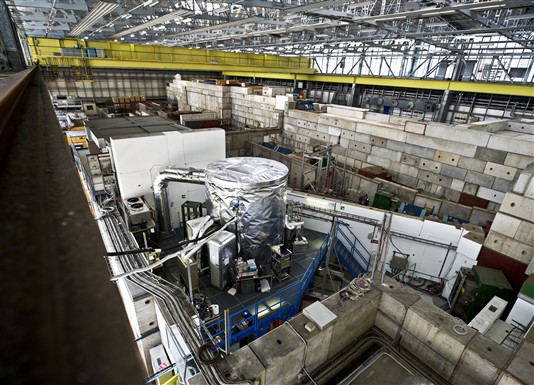
View of the CLOUD facility. Image courtesy of CERN
From a climate perspective, this is where nucleation becomes important; potentially around half of the cloud condensation nuclei (the building blocks of clouds) come from nucleation and in order to become these cloud seeds, they need to grow.
The four year gap between conferences provides an opportunity to observe a significant growth in our mechanistic understanding of how nucleation occurs. It will be interesting to see where the science will have led us in another 4 years.
Fire in my heart
A spell of dry weather. Summer sunshine beating down on the ground. An errant flame lights up an area of vegetation. Spectacular images of fire fighters battling wildfires on the sides of mountainous terrain. This has been a familiar refrain in the media over the past week or so but instead we’re not in California or Colorado – we’re in South Wales.
Last weekend saw the outbreak of several grass fires in South Wales, with reports in both local media (e.g. here, here and here) and the BBC (here and here). One of the largest reported fires (15 hectares) was in Glyncorrwg, to the north-east of Swansea, where firefighters battled for 18 hours to get the blaze under control. The South Wales Evening Post have a collection of images available here showing both the extent of the fire on the ground and the efforts of the fire service to tackle it. Credit should go to the fire services for getting the fire under control.
Grassland and heathland fires in the UK are not unusual, with 57,200 reported for 2011-12 by official statistics, which represents 30% of all outdoor fires. Having grown up in South Wales, grass fires were not an unusual occurrence. Typically, they are seasonal with the largest number occurring in April. Many of these will be fairly small but the Glyncorrwg fire was large enough to be observed from space!
Below is the MODIS image from onboard NASA’s TERRA satellite, with the red dots indicating fire ‘hot-spots’. The Glyncorrwg fire is the hot-spot inland, with another fire picked up on the coast near Port Talbot. Not only was the hot-spot detected but there is a visible plume of smoke in the image originating from the Glyncorrwg fire. As well as the obvious danger to life and buildings, wildfires can produce significant pollution amounts in a short space of time.

Satellite view of Wales on Saturday 8th June 2013. The red dots indicate fire hot-spots. The satellite image is from NASA’s Terra mission.
We can look at the fire in another way and compare it with others in Europe by looking at a measure of the ‘intensity’ of the fire. The MACC project provides daily maps of ‘Fire Radiative Power’ or FRP for short. The map for the 8th June shows that the fires in the MODIS image were among the most intense in Europe last weekend with an FRP of 5-10 mW/m2.
In this image, we can see the flames on the surface giving way to the plume of greyish smoke, which contrasts with the whiter smoke behind the main fire line. From an atmospheric science point of view, such observations are useful as they indicate the relative efficiency of the fires; flaming combustion is more efficient than the smouldering variety. With this information, we can make predictions of what pollutants the fire will produce. For example, a fire that is ‘flaming’ will produce more carbon dioxide than one that is smouldering. Black carbon or soot, is also more readily released by flaming fires. Smouldering fires produce more organic matter in the form of tiny aerosol particles. Such information is important for atmospheric scientists as it helps us to work out what impact these fires will have on our health and our climate.
Are pollutant emissions in the EU hitting the ceiling?
Ever wondered how different countries in the EU compare in terms of the amount of harmful pollutants they emit into the atmosphere? If yes, then you’ve come to the right place! If not, then I’m not sure how you ended up here but stick around any way. Recently, the European Environment Agency published a report on compliance with national emission ceilings for the member states of the EU. The report is put together annually by the National Emission Ceilings Directive (NECD) and is based on reporting of emissions of several harmful air pollutants, which are then compared with agreed target limits for each country. The remit of the NECD is set out in the executive summary of the report:
The NECD requires all 27 Member States to report information annually concerning emissions for four important air pollutants: nitrogen oxides (NOx), non-methane volatile organic compounds (NMVOC), sulphur dioxide (SO2) and ammonia (NH3). These pollutants can cause respiratory problems, contribute to the acidification and eutrophication of soil and surface water, and damage vegetation by exposure from tropospheric ozone resulting from these emissions. To help protect human health and the environment, the NECD sets pollutant-specific and legally binding emission ceilings for each of these pollutants and for each country, which were to be met by 2010 and in future years.
These pollutants are focussed on as they are harmful to our health (particularly via heart and lung disease) as they are involved in the formation of tiny aerosol particles and ozone. Below is an interactive dashboard (accessed by clicking on the image or here) that allows you to explore the data, including the level of emissions of each of the four pollutants and how far above or below the emission ceiling the different countries were. All of the data is based on the final 2010 figures rather than the preliminary 2011 data, which is subject to change in the next reporting cycle.

EU Emissions by member state for 2010. Data from EU Environment Agency available from here.
Clicking on the image or here will take you to an interactive Tableau visualisation where you can alter the pollutant of interest and explore the data yourself. You’ll also be able to see it a bit better!
Let’s take a look at the different pollutants.
Sulphur dioxide
Emissions of sulphur dioxide have been falling across Europe for some time, with particularly large decreases in Western Europe since acid rain became a major environmental concern in the 1980’s. All 27 of the EU member states were below their emission ceilings. Poland is by far the largest emitter in the EU, with double the emissions of Spain, Germany and the UK. This is due to the large number of coal power plants in Poland, including Bełchatów Power Station, which is the largest thermal power station in Europe.
Non-methane volatile organic compounds
NMVOCs, whose emissions are generally dominated by the transport sector, were within the emission ceilings for all countries aside from Germany and Denmark. In terms of absolute values, the big emitters are Italy, Germany, France, the UK, Poland and Spain (the big 6 from now on).
Ammonia
Ammonia emissions were also typically complied with aside from Finland and Spain, with Denmark and Germany slightly exceeding their national limits. The big 6 lead the way again, with France and Germany being the major emitters.
Nitrogen oxides
The picture is quite different for NOx, with eleven countries exceeding their emission ceilings. Another six countries were only 10% below their ceiling (including the UK). Again the big 6 lead the way in terms of absolute emissions, with Germany, France and Spain exceeding their emission ceilings. The UK, Poland and Italy were among the group that were cutting things relatively fine also.

Emissions from Europe can build up and travel hundreds of miles away from their source, forming a large mass of aerosol particles as they go. The image above is off the west coast of Ireland in May 2008 during such an event. Photo credit: Andreas Minikin
Overall, the main pollutant of concern as far as complying with the emission ceilings was NOx. The report states the main cause of this is the large emissions of NOx from road transport due to a combination of the large growth of this sector, coupled with an increasing number of diesel vehicles in the EU fleet. Diesel vehicles emit larger quantities of NOx than their petrol counter-parts.
Respect your boundaries
One of the difficulties with mandating nationwide limits on pollutant emissions is that the atmosphere doesn’t respect national boundaries – emissions from a car exhaust in London don’t suddenly come to a stop as soon as they reach the white cliffs of Dover. This presents a challenge for legislation and is one of the benefits of attempting to reduce emissions at the EU level.
The other issue is that these pollutants interact with each other resulting in the formation of those tiny particles and ozone that are bad for our health. An example of this is where NOx emissions from industrial and transport activities combine with ammonia emissions from agriculture. This cocktail forms an ammonium nitrate aerosol, which is then blown to other much ‘cleaner’ locations like the one pictured above off the west coast of Ireland.
This is something that I’ve personally looked at in my research, where emissions from Germany, the Netherlands and the UK combine into a potent mixture and form a large amount of ammonium nitrate aerosol on a regional basis, leading to air quality problems. The Netherlands role here is another subtle detail in the emission equation – it emits about half the amount of ammonia as the UK but over a much smaller area. This concentration of emissions leads to problems should you be downwind of this pollutant combination.
Dealing with these issues is a major challenge that we are only partially resolving at present.
————————————————————————————————————————————–
Links to my papers on ammonium nitrate are available below and are all open access.
Vertical Distribution of Sub-micron Aerosol Chemical Composition from North-Western Europe and the North-East Atlantic | http://www.atmos-chem-phys.net/9/5389/2009/
Airborne Measurements of the Spatial Distribution of Aerosol Chemical Composition Across Europe and Evolution of the Organic Fraction | http://www.atmos-chem-phys.net/10/4065/2010/
Enhancement of the Aerosol Direct Radiative Effect by Semi-volatile Aerosol Components: Airborne Measurements in North-Western Europe | http://www.atmos-chem-phys.net/10/8151/2010/
Mmm…donuts
If proof were ever needed that scientists rarely ‘switch off’, the following post is inspired by a lunchtime treat called Topfenbällchen, which I had after my presentation at the recent EGU General Assembly. A few of us remarked about how the donut-like dessert resembled an aerosol particle with a ‘coating’ but the question is what does this actually mean and what impact does this have on our atmosphere?

Topfenbällchen – a tasty dessert available in Vienna from your favourite local bakery. Picture courtesy of Jim McQuaid.
Aerosol particles are often referred to as separate species in a way that suggests they can be treated independently from each other when we assess their impact and/or how best to mitigate them. In the real atmosphere though, this is very rarely the case. Focusing on the image above, we see the jam centre of the Topfenbällchen with the dough surrounding this jam ‘core’. It turns out that this is often the structure that we observe for real aerosol particles in the atmosphere. One particular example of this is black carbon (or soot), which tends to take on the role of the jam ‘core’, while other types of particle form a coating around it in the same manner as the dough.
Whose coat is that jacket?
These coatings are a result of the vast number of other species that are emitted with black carbon e.g. during combustion of fossil fuels or wood. Often the coating will arise due to gases that were co-emitted with the black carbon condensing around the core, in the same way that a water droplet will form on a bathroom mirror. To complicate matters even further, the condensing gas might not have been emitted with the black carbon, for example, emissions from agricultural fertilisers or natural forests can also play a role. This liquid or solid coating can then ‘trap’ the black carbon core in the same way that the dough holds in the jam in the donut.
Feeling the benefit
From a climate perspective, black carbon warms the Earth’s temperature. A recent review study by Bond et al. assessed the role that black carbon plays in the climate system and concluded that:
…black carbon, with a total climate forcing of +1.1 W m-2, is the second most important human emission in terms of its climate-forcing in the present-day atmosphere; only carbon dioxide is estimated to have a greater forcing.
According to the study, the best estimate of the radiative forcing by black carbon is approximately two-thirds that of carbon dioxide. As mentioned previously, black carbon is not a lone wolf and is typically associated with other species. These species can have very different qualities, including the ability to cool the Earth’s temperature. The study was quick to note this point:
Sources that emit black carbon also emit other short-lived species that may either cool or warm climate.
Taking these additional sources into account is extremely complex as we’re attempting to assess how one uncertain aspect (black carbon) interacts with a multitude of other uncertain aspects (other short-lived species). Undeterred though, the study concluded that the best estimate for the forcing from black carbon combined with its co-emitted species was slightly negative but with huge uncertainties. The estimates ranged from cooling or warming that was comparable to the amount of forcing by carbon dioxide. In essence, black carbon and its partners in crime could either largely offset the historical radiative effect of carbon dioxide or add on an extra layer of warming to it.
I’ll get my coat
It turns out that how the dough combines with the jam core is particularly important when assessing the impact of atmospheric aerosols on climate. This is an essential consideration when we examine how we might mitigate these particles, as this mixture is highly complex and difficult to control at the level of an individual species. For example, if we attempted to limit emissions of black carbon, we are highly likely to alter the rest of the chemical cocktail. As we have seen, we’re currently uncertain about how the results of this might pan out.
There is much more surrounding this topic but I’ll leave it for a later time. Did someone say cake?
So long #EGU2013 and thanks for all the science
I spent the last week at the European Geosciences Union (EGU) General Assembly in Vienna hearing about some of the latest research findings in this broad field of science. I thought I would put together a collection of random thoughts on the meeting below.

The Riesenrad, my favourite spot in Vienna (aside from the conference centre of course). I actually took this photo at the 2009 meeting – I do recall the weather being somewhat better that year.
Science overload
One of the great strengths and weaknesses of a conference as large as the EGU, where over 10000 scientists attend, is the substantial breadth and depth of the science on offer. Between the parallel talks and poster sessions, there is a vast amount of interesting research being presented. This is supplemented by various discussion forums, courses and debates.
As researchers we tend to increasingly narrow our focus down to the incredible minutiae within our field so it is nice to broaden things out. I find that it is a great way to generate some new ideas for my own work. It also provides context for how your small slice of the atmospheric pie fits into the whole Earth system. It isn’t for everyone and I also find conferences with a much narrower subject area worthwhile but it is worth bearing in mind if you’ve not been to many conferences before.
Science highlights
As far as the actual science was concerned, the two major sessions that I found the most engaging were the sessions on pollution in ‘Megacities’ and the ‘Fire in the Earth System’ session.
Some of the figures in the Megacities session were incredible; our ability to inject vast quantities of pollution into the environments where around 50% of us live would be impressive were it not for the harm it causes. The health and environmental consequences of this pollution are potentially vast, especially as cities across the globe increasingly expand and people fill them.
The session on fires was especially helpful as it demonstrated the elements of this major issue that we do not currently understand and set some of the context for my current research, which I presented in the session. The talks in the session spanned several continents (Antarctica was the only continent not represented) which is appropriate given that the smoke from these fires can be transported across huge distances, yielding an impact on the global scale.
Science online
One of the most impressive features of the EGU this year was the prevalence of social media usage. I felt this added an extra dimension to the experience and allowed me to ‘follow’ other aspects of the conference easily. With so many sessions occurring at once, you almost always have to make a choice over which talk to go to. Often this leaves you feeling that you might have missed out.
However, via Twitter, I was often able to tune into the headline conclusions and figures from other sessions. In particular, Sam Illingworth and the Air Quality Group at the University of Leicester kept me up to date with other atmospheric pollution sessions that I wasn’t able to attend.
Social media usage wasn’t just solely limited to following session highlights though. Several discussions broke out online, which added a unique element to the conference for me. While Twitter was certainly a facet of the AGU meeting I attended in December, it was more passive in nature than the EGU.
Most importantly, social media served as a way of meeting some excellent scientists and great people!
Science is awesome
To sum up, I really enjoyed EGU 2013! I’ve got a few ideas for some blog posts inspired by some of the awesome science at the meeting, which I’ll hopefully write in the coming weeks.
——————————————————————–
I gave some additional reflections on the meeting on the Barometer Podcast audio diary.


